
Gold:-
On the weekly chart, MCX Gold price has been trading in bullish trend; where price has given falling trend breakout and sustained above it. In addition, Price has bounced back from middle band of Bollinger pattern; which indicate strong support for the prices. Moreover, momentum indicator RSI has turned from lower and shown positive crossover on daily chart. Based on the above technical aspects, we expect bullish movement in MCX Gold prices.
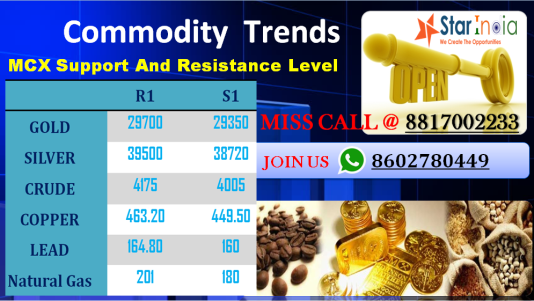
Silver:-
On the weekly chart, MCX Silver has been trading in range bound momentum; where price has traded above 61.8% retracement level; which supported the price to move further up. On the other hand, Price has sustained above falling trendline breakout. Moreover, Silver has tested 21 days EMA and moved up; which react as immediate support level for the price. Furthermore, MACD has shown positive crossover on daily chart. Based on the above technical set up and indicators, we expect a bullish move in MCX Silver price.
Crude:-
Crude Oil prices hit $64 for first time in three year with monthly gain of around 5.92%. Overall, Crude Oil price is in bullish trend and rising consecutively from last couple of the weeks; where it is forming higher highs & higher low pattern on daily chart. Moreover, price has been trading above 21 days EMA on daily chart. Furthermore, MACD is in buying mode with positive crossover. On the other hand, Fundamental sentiments are supporting the prices. Based on the above technical structure, we keep our bullish view in Crude Oil future.
Copper:-
Copper has started the day on positive note and traded higher for entire day, which indicate positive strength in the prices. On the other hand, MCX Copper has been trading in broadening formation on daily chart; where price has shown recovery after giving a small correction. Moreover, RSI (14) has shown positive crossover on daily chart. So based on the above technical structure, we expect upside movement in MCX Copper future.
Natural gas:-
MCX Natural gas price opened on flat note and shown upward movement in second half of the session, where price has increased by 2.7% for the day. On the daily chart, MCX Natural Gas has formed “Bullish Harami” pattern; which is a sign of trend reversal and indicate bullish move for medium term. In addition, Price has been trading between falling channel pattern; which suggest rising breakout in the prices. Therefore, based on above technical studies we expect further bullish move in MCX Natural Gas.
